Q4 2022 Northern California Real Estate Market Update
[ad_1]
The following analysis of select counties of the Northern California real estate market is provided by Windermere Real Estate Chief Economist Matthew Gardner. We hope that this information may assist you with making better-informed real estate decisions. For further information about the housing market in your area, please don’t hesitate to contact your Windermere Real Estate agent.
Regional Economic Overview
Total employment in the Northern California counties covered by this report rose 64,800 over the past 12 months. Though this was a significant slowdown from earlier in the year, it’s not surprising given the expectation of a possible national economic slowdown in 2023 and its impact on hiring decisions. The regional unemployment rate fell from 3.9% to 3% between November 2021 and November 2022. The lowest jobless rate was in Santa Clara County at 2.4% and the highest rate was in Shasta County at 4.3%. I expect the region to continue adding jobs in 2023, but I believe the pace of growth will slow.
Northern California Home Sales
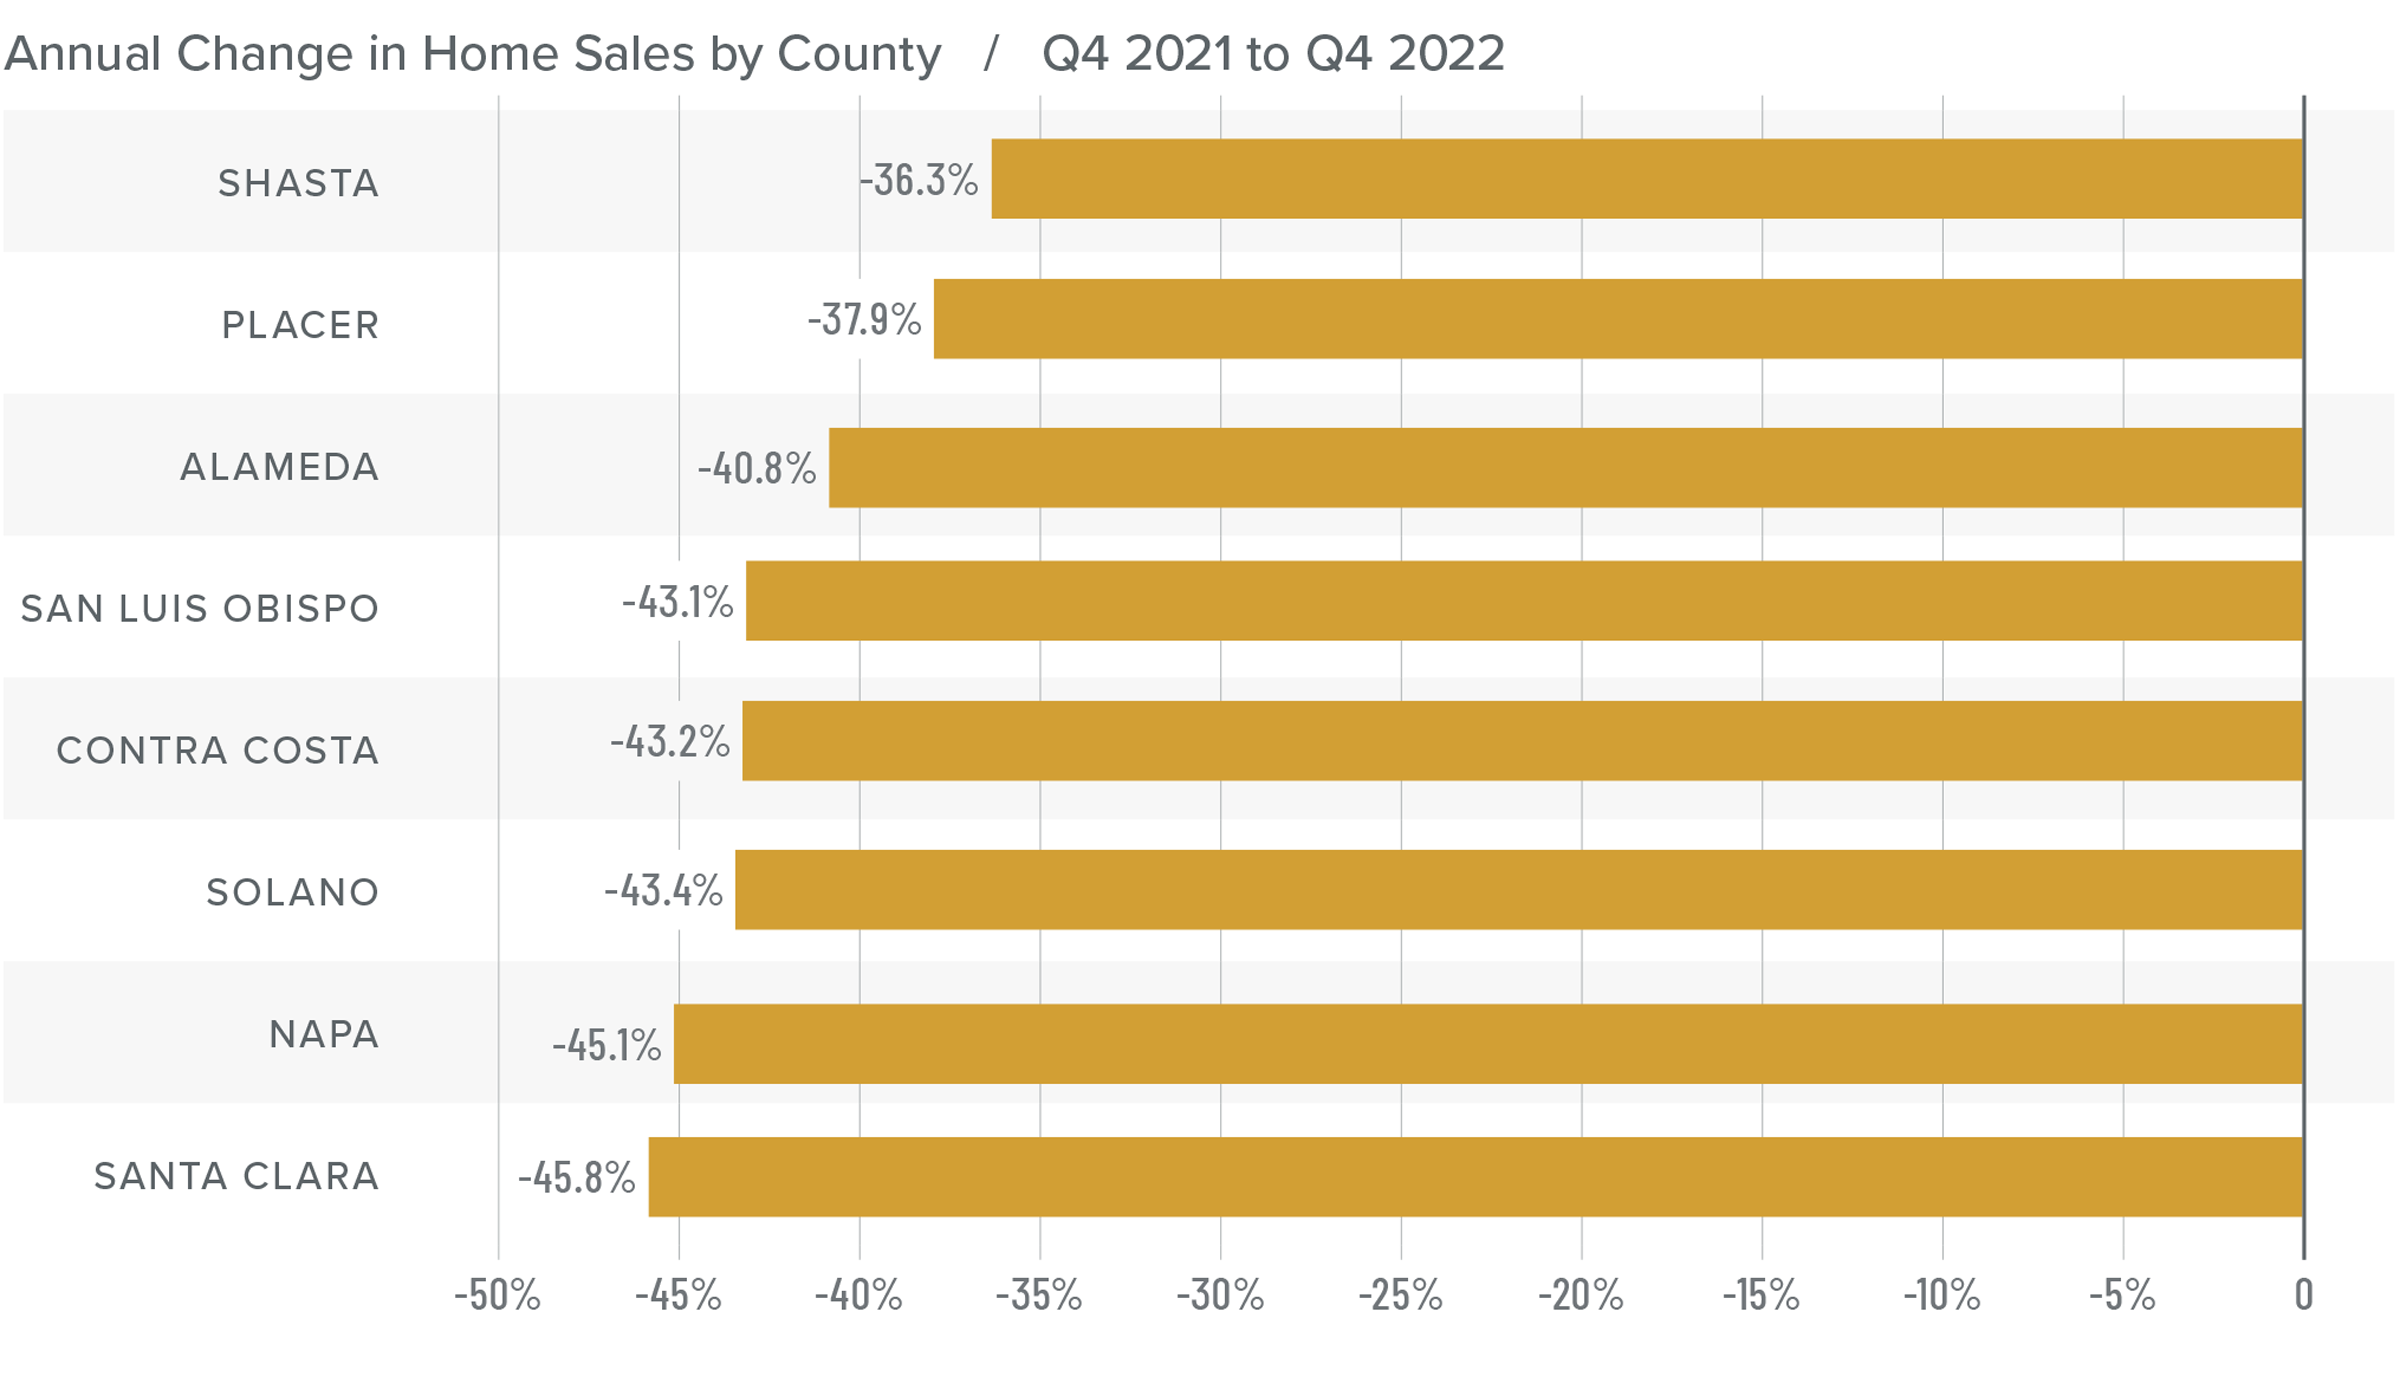
❱ In the final quarter of 2022, 8,388 homes sold, a significant drop from the more than 14,000 homes that sold in the fourth quarter of 2021. Sales were 26.8% lower than in the third quarter of 2022.
❱ Year over year, sales fell across the board. The largest drop was in Santa Clara County but the decline in sales was pronounced across the region.
❱ Listing inventory was down more than 31% from the third quarter of 2022, but increased over 46% compared to the fourth quarter of 2021. Potential buyers have more choice in the market than they have seen in several years.
❱ Pending home sales fell 35% from the third quarter, suggesting that the market continues to soften.

Northern California Home Prices
❱ Higher financing costs continue to impact sale prices. The average price of a home sold in the region dropped 5% from the same period in 2021. Sale prices were 6.6% lower than in the third quarter of 2022.
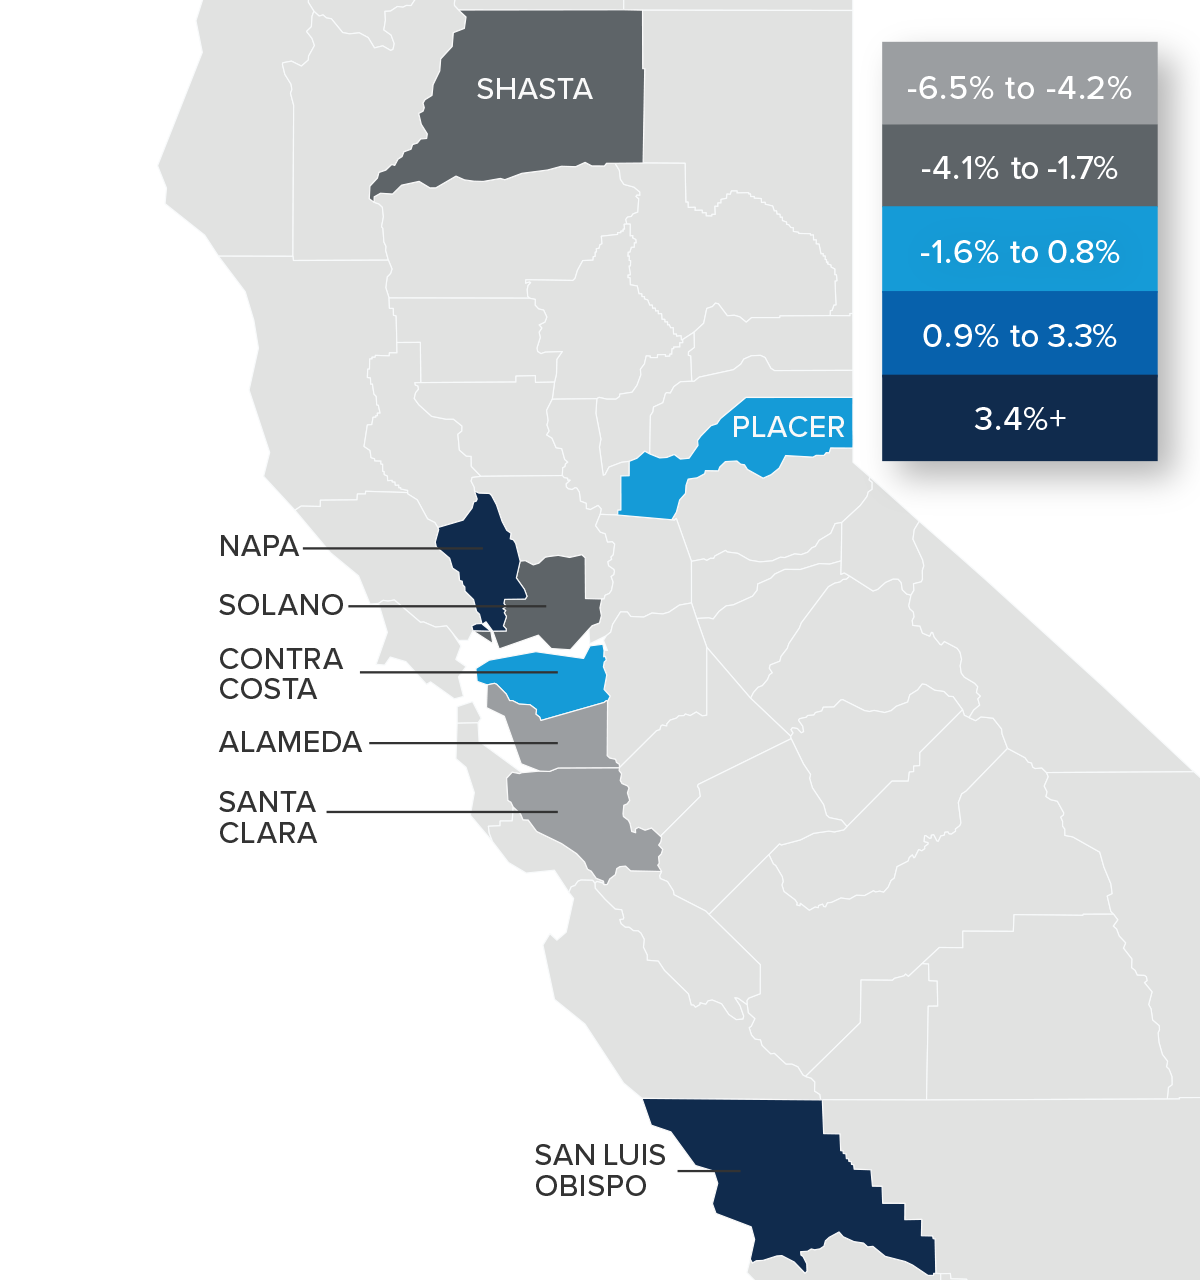
❱ Median listing prices in the region fell in all markets other than Contra Costa and San Luis Obispo counties compared to the third quarter. The market with the biggest drop was Napa County, where the median list price fell 4.2%.
❱ Year over year, prices increased in Napa and San Luis Obispo counties but fell in the balance of the region. Only San Luis Obispo County saw prices increase compared to the third quarter of 2022.
❱ With falling prices and growing inventory across most of the region, the market is clearly starting to reflect the higher mortgage rate environment.


Mortgage Rates
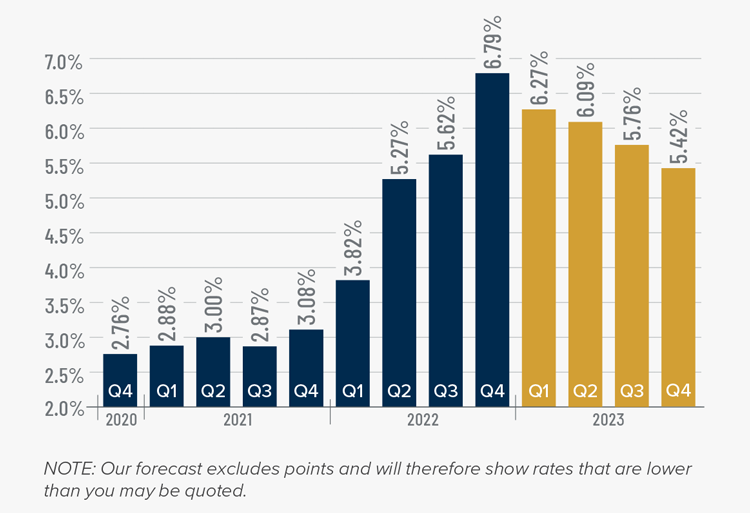
Rates rose dramatically in 2022, but I believe that they have now peaked. Mortgage rates are primarily based on the prices and yields of bonds, and while bonds take cues from several places, they are always impacted by inflation and the economy at large. If inflation continues to fall, as I expect it will, rates will continue to drop.
My current forecast is that mortgage rates will trend lower as we move through the year. While this may be good news for home buyers, rates will still be higher than they have become accustomed to. Even as the cost of borrowing falls, home prices in expensive markets will probably fall a bit more to compensate for rates that will likely hold above 6% until early summer.

Northern California Days on Market
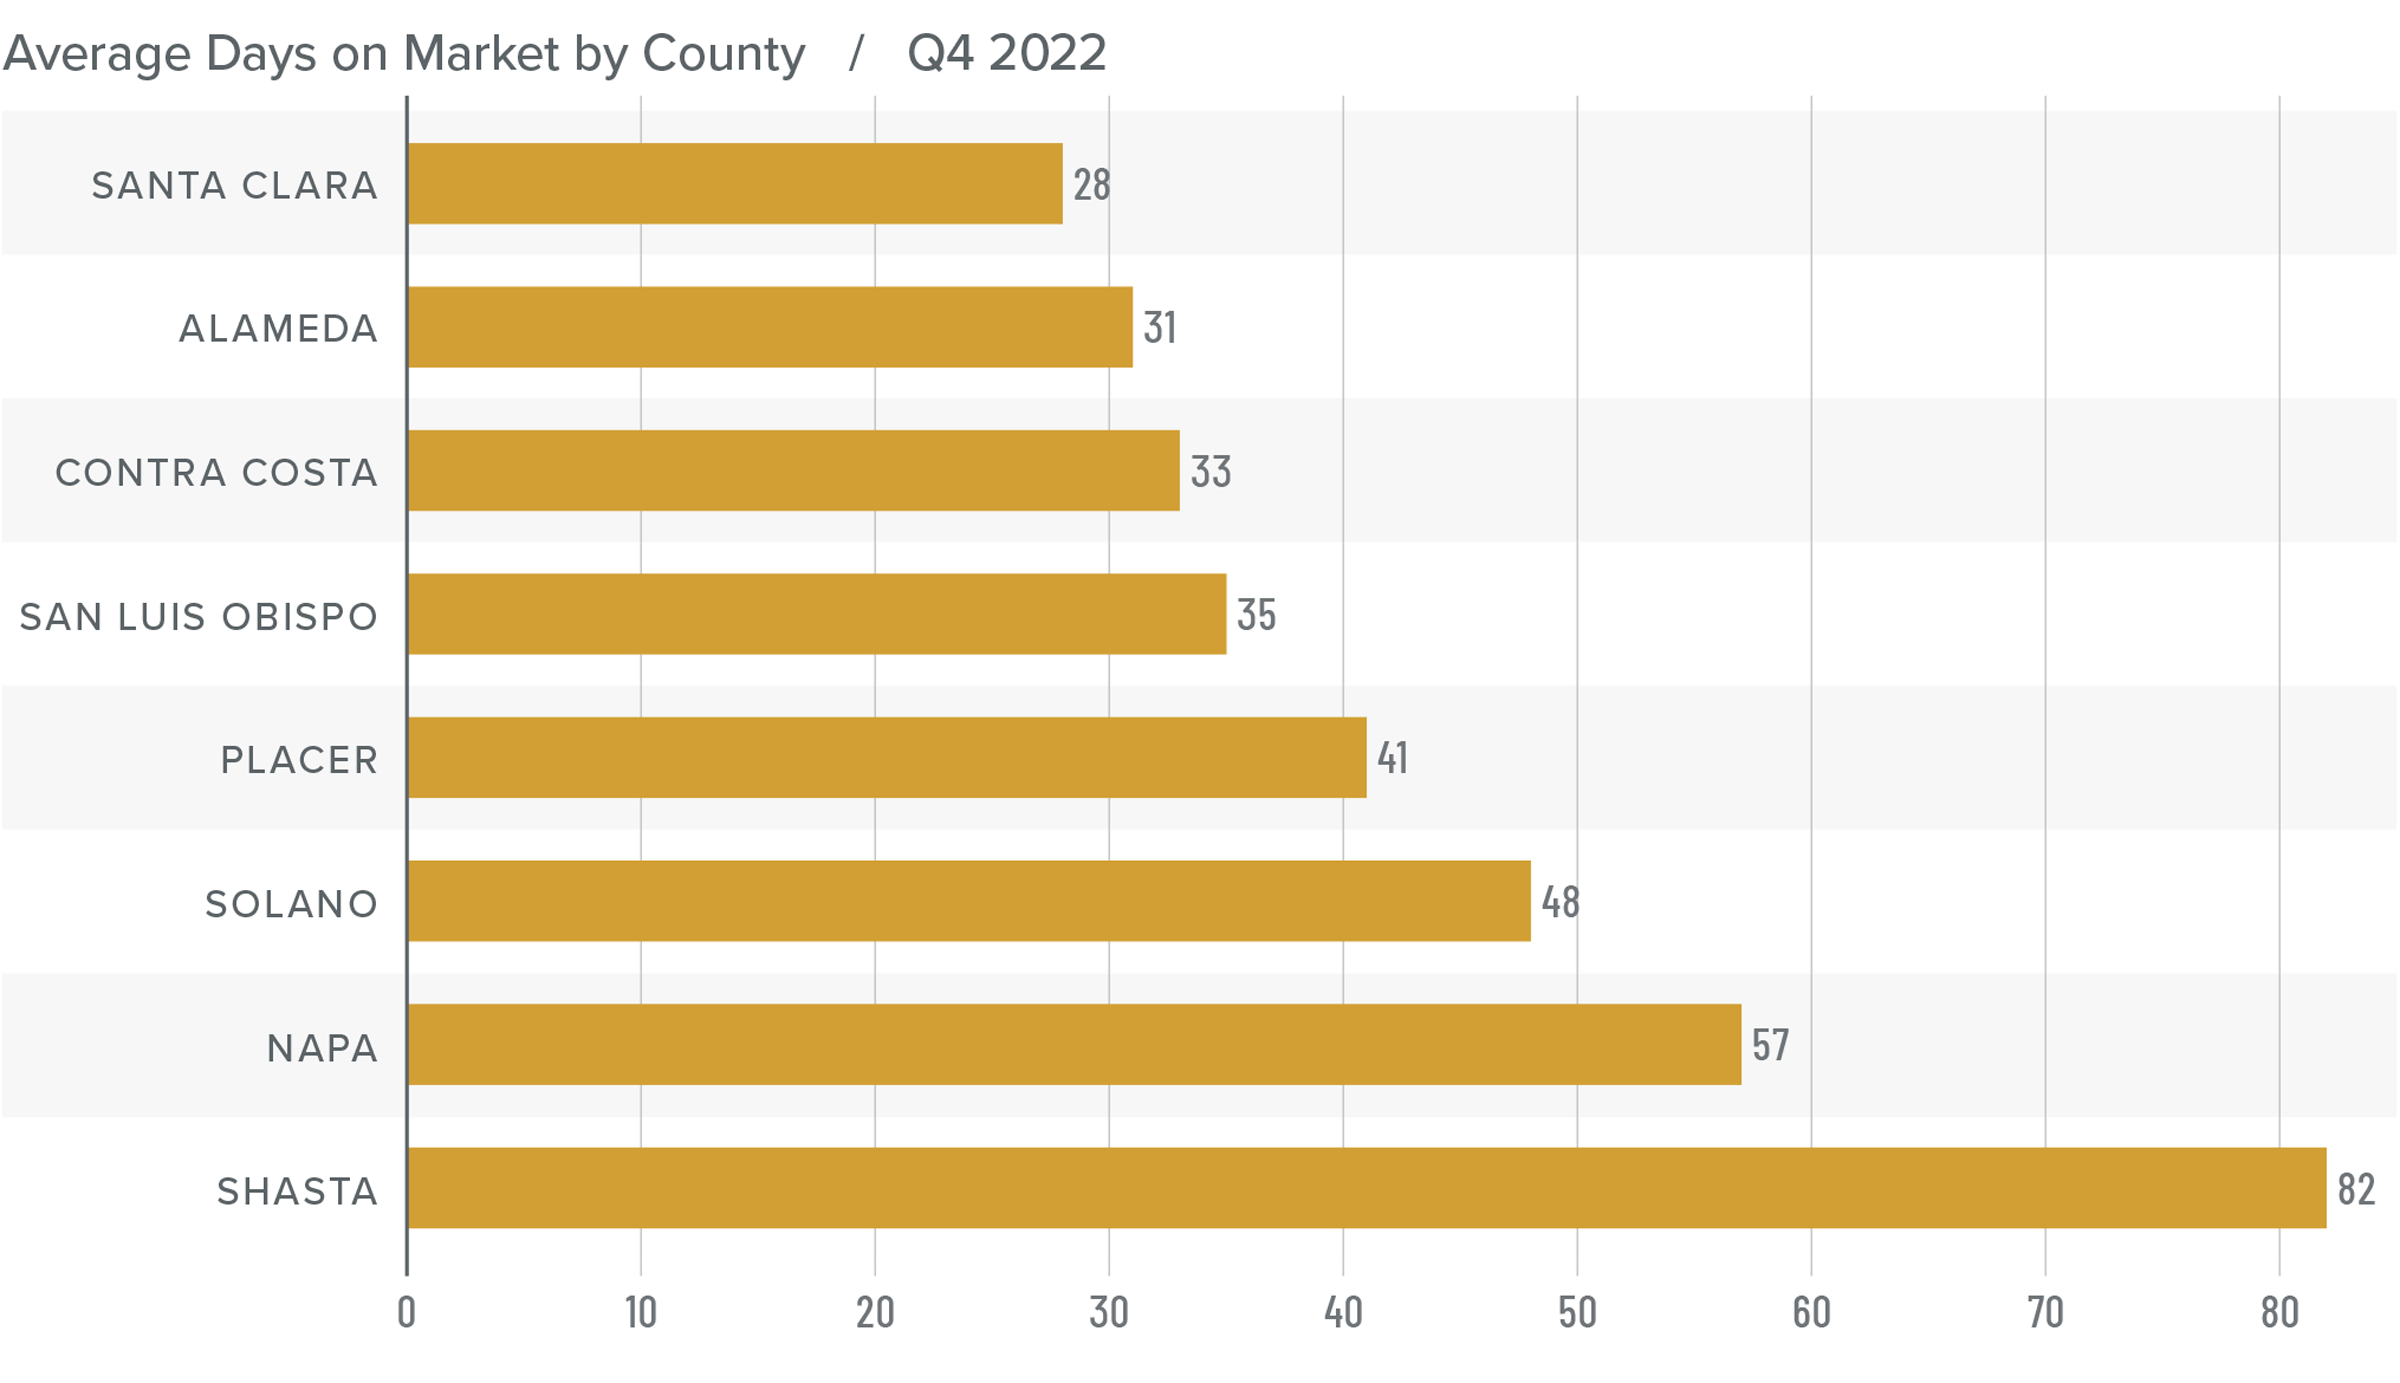
❱ The average time it took to sell a home in the Northern California counties in this report rose 12 days compared to the final quarter of 2021.
❱ Year over year, the length of time it took to sell a home was static in Napa County but rose across the rest of the region. Compared to the third quarter of 2022, market time rose across all counties except Placer County, where it fell 13 days.
❱ It took an average of 44 days to sell a home during the fourth quarter, which was 9 more days than in the third quarter of 2022.
❱ As we’ve seen over the past several months, the increase in homes for sale is allowing buyers to be more selective. Moreover, there are likely buyers waiting until the spring in the hopes that prices and mortgage rates may be more favorable.

Conclusions
This speedometer reflects the state of the region’s real estate market using housing inventory, price gains, home sales, interest rates, and larger economic factors.
Employment continues to grow, but the pace of growth is slowing, which may be acting as a modest headwind to the housing market. Buyers have not disappeared completely, but the market is continuing to move away from the frenetic pace of the pandemic period. Home values in the region will likely continue to fall due to the highest mortgage rates in more than 15 years. That said, I expect rates will pull back as we move through 2023. Although they may be higher than buyers would like to see in the coming months, I believe the market will find stability later this year. As rates get closer to 5%, more buyers will start to look for a home.

Given all the data discussed here, I am moving the needle further in favor of buyers and into what can best be described as a neutral position.
About Matthew Gardner

As Chief Economist for Windermere Real Estate, Matthew Gardner is responsible for analyzing and interpreting economic data and its impact on the real estate market on both a local and national level. Matthew has over 30 years of professional experience both in the U.S. and U.K.
In addition to his day-to-day responsibilities, Matthew sits on the Washington State Governors Council of Economic Advisors; chairs the Board of Trustees at the Washington Center for Real Estate Research at the University of Washington; and is an Advisory Board Member at the Runstad Center for Real Estate Studies at the University of Washington where he also lectures in real estate economics.
!function(f,b,e,v,n,t,s)
{if(f.fbq)return;n=f.fbq=function(){n.callMethod?
n.callMethod.apply(n,arguments):n.queue.push(arguments)};
if(!f._fbq)f._fbq=n;n.push=n;n.loaded=!0;n.version=’2.0′;
n.queue=[];t=b.createElement(e);t.async=!0;
t.src=v;s=b.getElementsByTagName(e)[0];
s.parentNode.insertBefore(t,s)}(window, document,’script’,
‘https://connect.facebook.net/en_US/fbevents.js’);
fbq(‘init’, ‘481214665657385’);
fbq(‘track’, ‘PageView’);
[ad_2]


